Car rental fleet utilization is the share of rentable vehicle time that produces completed rental days. But a high percentage is not automatically healthy. Utilization only creates durable value when the rate is sound, the vehicle is actually ready, and the branch can complete pickup and return without pushing risk into the next booking.
That is why utilization cannot live only in a monthly report. Operators need a daily view of pressure by branch and category, a defined transfer decision, and a weekly review that connects rented days to rate quality and execution.
This playbook gives multi-branch and growing independent rental companies a control system for doing that without treating every idle vehicle as a reason to discount or relocate.
Measure rentable capacity before utilization
Start by defining the denominator. If the fleet has 100 vehicles for a seven-day week, it does not automatically have 700 rentable vehicle-days.
Remove time that is legitimately unavailable under your operating rules:
- Maintenance or qualified safety review
- Repair or damage assessment
- Cleaning and turnaround
- Registration or document block
- Planned disposal or onboarding
- Transfer time before receiving readiness
- Other operator-defined blocks
Then calculate:
Time utilization = completed rental days ÷ rentable vehicle-days
Keep planned and unplanned unavailability separate. A scheduled maintenance block and a vehicle waiting three days for an undefined owner both reduce capacity, but they call for different decisions.
Do not quietly remove avoidable downtime to improve the percentage. The readiness board should show why the time was excluded and who owns the next action. The rental fleet downtime control playbook provides the supporting state, waiting-time, booking-exposure, and release record.
For the booking-side decision, the car rental availability management guide separates physical fleet count from the capacity a branch may actually promise for a time window.
Read utilization through three lenses
One number cannot explain fleet health. Review three connected dimensions:
Scroll to compare every column
| Lens | Operator question | Misleading “good” result |
|---|---|---|
| Time utilization | How many rentable days were completed? | High total usage hides idle classes or branches |
| Rate quality | Were those days sold inside the approved rate guardrails? | Occupancy rises because broad discounts erode value |
| Execution quality | Could the team prepare, hand off, and close the rental cleanly? | A full calendar creates late pickups and rushed returns |
This prevents the familiar mistake: “We are full, so the operation must be healthy.”
A fourth context signal is useful: commitment pressure. It shows how much future demand depends on late returns, units in transfer, incomplete inspections, or unresolved maintenance. It is not another vanity score. It tells managers when current utilization is borrowing capacity from the next rental day.
If the source data still lives in disconnected sheets, start with car rental software vs spreadsheets.
Break the number down by branch and category
Network averages hide the decision.
Imagine this illustrative week:
Scroll to compare every column
| Location and class | Rentable vehicle-days | Completed rental days | Time utilization |
|---|---|---|---|
| Central, economy | 84 | 72 | 85.7% |
| Central, SUV | 42 | 22 | 52.4% |
| North, economy | 63 | 58 | 92.1% |
| North, SUV | 35 | 31 | 88.6% |
The network total is 183 completed rental days from 224 rentable days, or 81.7%. That aggregate sounds healthy. The branch-and-class view shows a different operating question: Central has idle SUV capacity while North carries high SUV pressure.
That does not automatically mean “move SUVs north.” First check:
- Future booking pressure at both branches
- Whether the vehicles are truly ready
- Transfer time and cost
- Category and substitution rules
- One-way return patterns
- Staff capacity to depart, receive, and prepare the vehicles
- Customer commitments that rely on each unit
The breakdown reveals where to investigate. It does not replace the decision.
Use a daily fleet pressure board
The daily board should cover today through the operator’s useful planning horizon. For some fleets that is three days; for others it is two weeks. Use the horizon that matches booking lead time and transfer reality.
Scroll to compare every column
| Signal | What it reveals | Next operating question |
|---|---|---|
| Ready units by branch and category | Capacity available now | Is the supply aligned to upcoming pickups? |
| Expected returns and extensions | Capacity that may re-enter or remain occupied | Which next bookings depend on those returns? |
| Units blocked by reason | Capacity loss and work ownership | Is the cause legitimate, and who clears the next step? |
| Vehicles in transfer | Capacity changing location | Who has custody and when can destination use the unit? |
| Unassigned upcoming bookings | Demand without a protected unit or class plan | What decision is due, and who owns it? |
| Idle age | Rentable units producing no days | Is the cause demand, price, visibility, class, or location? |
| Rate exceptions | Utilization purchased through discount | Did the exception stay inside the approved boundary? |
Review the branch/category intersection before the total. A vehicle can be idle in the network and still be useless for the customer commitment under pressure.
For the authority, transfer custody, and exception model behind this board, use the multi-branch car rental operations playbook.
Diagnose idle time before changing price
Idle time has different causes. Match the action to the cause.
Demand gap
The right customer is not arriving on the idle days. Test a specific segment, channel, or day pattern before cutting rates broadly.
Visibility gap
The unit or category is not correctly available in the selling workflow. Fix stale blocks, category mapping, channel rules, or incomplete preparation first.
Price or condition gap
The offer does not match market willingness, but the cause could be price, minimum duration, deposit, mileage, delivery area, or another condition. Change one controlled variable and preserve the floor.
Location gap
Demand exists elsewhere in the network. Evaluate a transfer against origin exposure, destination pressure, timing, cost, and readiness.
Readiness gap
The vehicle is physically present but cannot be promised. Assign the cleaning, inspection, maintenance, document, or evidence step with an owner and expected completion.
Category-mix gap
The branch repeatedly carries the wrong fleet mix for its demand. That may require a longer-term acquisition, disposal, or allocation decision—not a weekly discount.
When a specific unit is expensive to keep or the category mismatch persists, use the car rental fleet replacement decision guide to compare repair, transfer, replacement, and retirement against the next booking window.
Make transfer decisions with net operating impact
Relocation can improve utilization, but random movements add mileage, staff time, fuel or charge cost, custody risk, and preparation work.
Use this sequence:
1. Confirm destination pressure
Identify the category, dates, protected customer commitments, and alternatives. “North looks busy” is not a transfer trigger.
2. Confirm origin slack
Review booked demand, probable extensions, planned maintenance, and local substitution needs. A currently parked vehicle may already protect a future commitment.
3. Calculate the movement cost
Include:
- Driver or transporter time
- Fuel, charging, tolls, and mileage
- Coordination and receiving time
- Preparation at destination
- Opportunity cost if origin demand appears
- Risk created by late arrival or missing evidence
4. Estimate incremental contribution
Use the expected additional rental days and rate, then subtract variable rental cost and transfer cost. Treat uncertain demand as uncertain; do not record a forecast as a confirmed booking.
5. Protect the custody chain
Record origin, destination, departure owner, movement owner, expected arrival, condition evidence, receiving owner, actual receipt, and the action required to become ready.
6. Compare alternatives
The best decision may be to keep the vehicle, adjust a condition, protect a higher-value local booking, use an allowed substitution, or decline unprofitable demand.
Research on rental operations has long modeled fleet transfer as a decision connected to demand and cost, not a simple count of parked cars. One study of a two-city rental system found that the quality of the transfer policy remained important even when fleet size was well selected. See the fleet size and vehicle transfer study. Use that as supporting context; your policy still needs your own demand, cost, timing, and service constraints.
Protect rate quality while improving rented days
When utilization falls, broad discounting is tempting because it changes demand quickly. It can also hide the operating cause and weaken future price discipline.
Use this order:
- Confirm that availability and readiness are accurate.
- Find the branch, category, and day pattern causing the gap.
- Review offer conditions such as minimum duration, pickup window, included mileage, delivery, or package.
- Target the customer segment or channel that fits the idle capacity.
- Adjust rate only inside a published floor and authority limit.
- Review whether the additional rental day still contributes after variable and execution cost.
Record the reason for every material rate exception. The weekly review should distinguish healthy incremental demand from utilization bought through uncontrolled discounting.
For a deeper rate framework, see car rental pricing strategy.
Add readiness and handoff constraints
Utilization pressure becomes dangerous when a branch promises more work than it can prepare.
Before protecting another rental day, check:
- Return-to-ready turnaround time by branch
- Cleaning and inspection workload
- Open maintenance or qualified review
- Contract and customer requirements
- Deposit, payment, or balance state
- Staff capacity at the pickup and return windows
- Transfer arrival and receiving capacity
- Evidence required before the vehicle changes state
Do not use a utilization target to override safety, legal, contract, or company-policy controls. Evidence can show completeness, provenance, freshness, and consistency; it does not decide damage, liability, spend, or vehicle release.
Run a weekly utilization control review
The review should produce decisions, not just percentages.
Scroll to compare every column
| Review area | Cut the data by | Decision to make |
|---|---|---|
| Time utilization | Branch, category, weekday/weekend | Correct demand, allocation, or readiness gap |
| Rate quality | Branch, class, channel, exception reason | Protect floor or revise a specific offer |
| Idle age | Vehicle, category, branch, block reason | Assign commercial, transfer, or readiness action |
| Transfer results | Route, reason, cost, arrival, rental outcome | Keep, revise, or stop a trigger |
| Commitment pressure | Late return, transfer, maintenance, unassigned booking | Protect exposed pickups and assign owners |
| Execution quality | Pickup delay, missing evidence, turnaround, repeat exception | Change capacity or workflow before adding demand |
Use owner-defined thresholds grounded in baseline and economics. A seasonal branch should not inherit a generic utilization target from a different market.
Every action needs:
- A specific branch and category
- A named owner
- A due date
- The signal that will show whether it worked
- A stop condition if rate, service, or readiness deteriorates
Use the broader car rental KPI scorecard to connect this fleet review with qualified demand, handoff timing, balance closure, and aged exceptions.
A worked transfer calculation
Suppose an SUV at Branch Central has four rentable idle days next week. Branch North has a qualified request for three days, but no ready SUV in that window.
Illustrative inputs:
- Expected rental revenue: 3 days × $95 = $285
- Variable rental and preparation cost: $42
- Driver, fuel, toll, and receiving cost: $68
- Expected incremental contribution before transfer: $243
- Expected contribution after transfer cost: $175
That $175 is not yet the decision. Check whether Central needs the unit, whether the request is confirmed under policy, whether arrival leaves enough preparation time, and whether an allowed alternative costs less.
If the request is only a probability, weight the expected value conservatively or wait for the defined confirmation state. Do not spend a certain transfer cost against demand that the team is treating as certain only because it is in a chat.
Improve utilization in a 30-day sprint
Week 1: establish trustworthy capacity
- Define rentable and unavailable time
- Reconcile vehicle state by branch and category
- Assign every readiness block
- Publish the daily pressure board
Week 2: diagnose the largest gaps
- Split utilization by branch, category, and day pattern
- Review idle age and rate exceptions
- Classify each gap as demand, visibility, price, location, readiness, or mix
- Select one corrective action per major gap
Week 3: test controlled actions
- Run one targeted demand action
- Execute only transfers that pass the net-impact test
- Protect rate floors and authority limits
- Record receiving evidence and actual result
Week 4: institutionalize the review
- Compare expected and actual rental days and contribution
- Review service and readiness impact
- Keep, revise, or stop each trigger
- Publish next-month owners by branch and category
Where Resvo fits
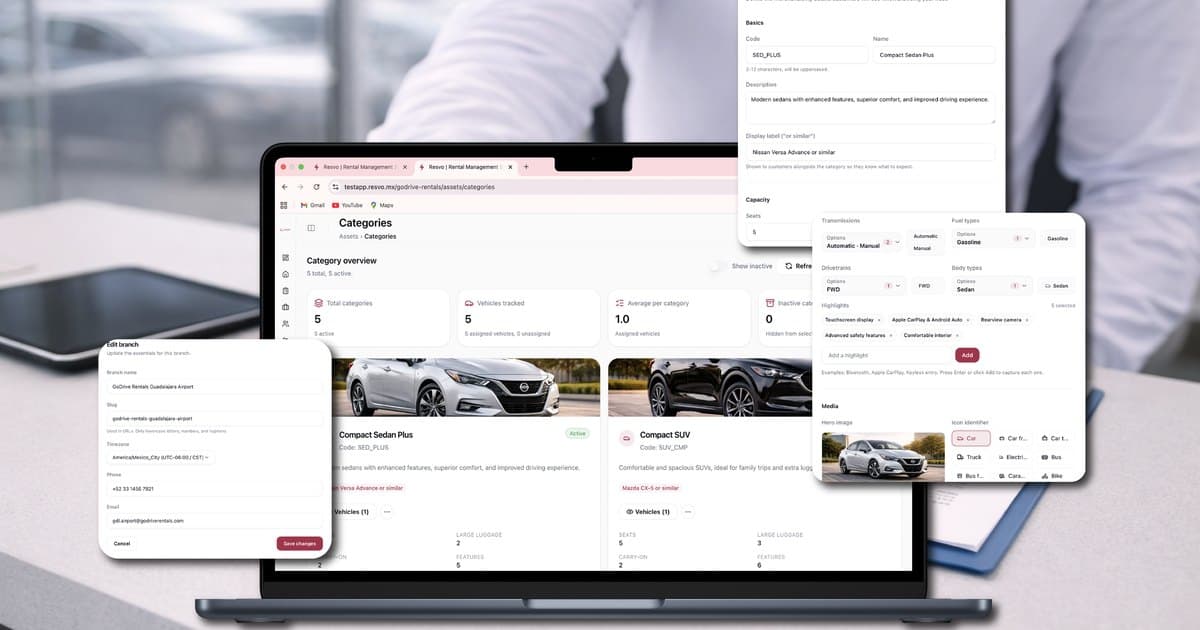
Resvo is a Rental Management System and system of record for the rental lifecycle. Its operating surfaces connect booking and availability context, vehicle assignment and movement, customer and contract details, payment and balance context, handoff and return work, tasks, and reporting.
For utilization, that means branch teams can work from connected operating context instead of reconciling the fleet plan after the demand window has passed. Managers still define rate authority, transfer policy, readiness rules, and sensitive approvals.
Explore rental operations, visibility and control, or book a demo to map utilization by branch and category into a controlled weekly workflow.
Frequently asked questions
What is a good car rental fleet utilization rate?
There is no universal rate that proves a fleet is healthy. Seasonality, category mix, rental duration, rate quality, maintenance, branch model, and service capacity change the target. Compare against your own profitable baseline by branch and category.
Should unavailable vehicles be included in utilization?
Define rentable capacity consistently and report unavailable time separately by reason. Do not remove avoidable downtime merely to improve the utilization percentage.
When should a rental vehicle move between branches?
Move it when destination pressure is specific, origin slack is real, incremental contribution exceeds movement cost and risk, and the custody and readiness plan can protect the customer commitment.
Is discounting the fastest way to improve utilization?
It can change demand, but it may reduce rate quality or hide a visibility, readiness, location, or category problem. Diagnose the gap first and protect published rate floors.
What should managers review every week?
Review time utilization, rate quality, idle age, transfer outcomes, commitment pressure, readiness, and execution by branch and category. Finish with named owners, due dates, and stop conditions.